Project Overview
This project contains an initial EDA of data from a hypothetical advertisement company and analyzes how different features impact the probability of a customer clicking on their advertisement.
It dives into how certain features impact each other and our target variable.
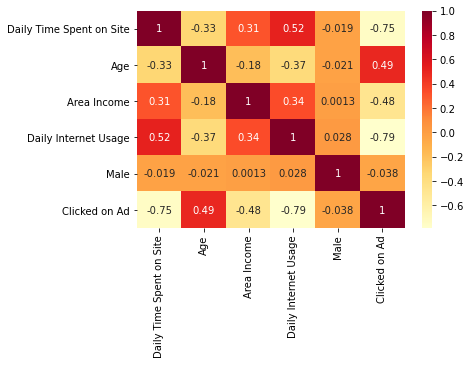 Correlation between features using a heatmap
We try and understand how to train our model and which features to use whilst training it through various other visualizations.
Lastly, we look at certain metrics and visualization in order to evaluate the model and see how well it is able to predict whether the user has clicked on the ad or not.
Correlation between features using a heatmap
We try and understand how to train our model and which features to use whilst training it through various other visualizations.
Lastly, we look at certain metrics and visualization in order to evaluate the model and see how well it is able to predict whether the user has clicked on the ad or not.
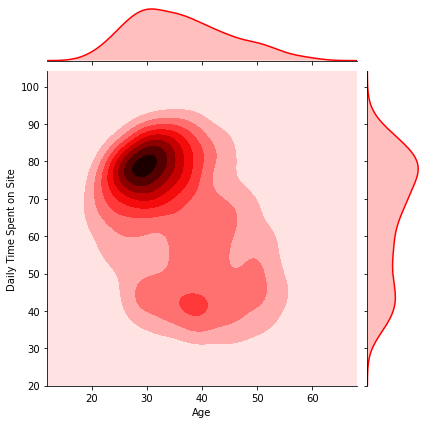 Correlation between age of customers and time spent on the app
We use a simple logistic regression model to solve this binary classification problem using scikitlearn and other visualization libraries.
Head over to the link below to check out the entire python notebook which contains a more in-depth exploration of the data along with various other visualizations.
Correlation between age of customers and time spent on the app
We use a simple logistic regression model to solve this binary classification problem using scikitlearn and other visualization libraries.
Head over to the link below to check out the entire python notebook which contains a more in-depth exploration of the data along with various other visualizations.